Laminar
Open-source tracing, replay, and evals for AI agents, from laptop to CI
- Category
- AI & agent tooling
- Best-fit role
- LLM evaluation engineer DX study
- Focus
- Eval templates Instrumentation integrations SDK docs and tutorials
- Links
- laminar.sh
The product
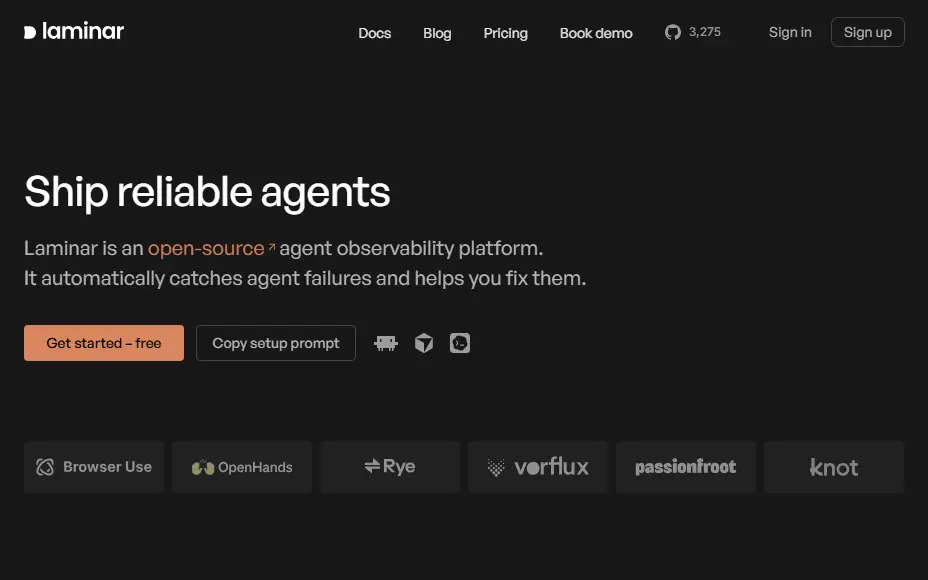
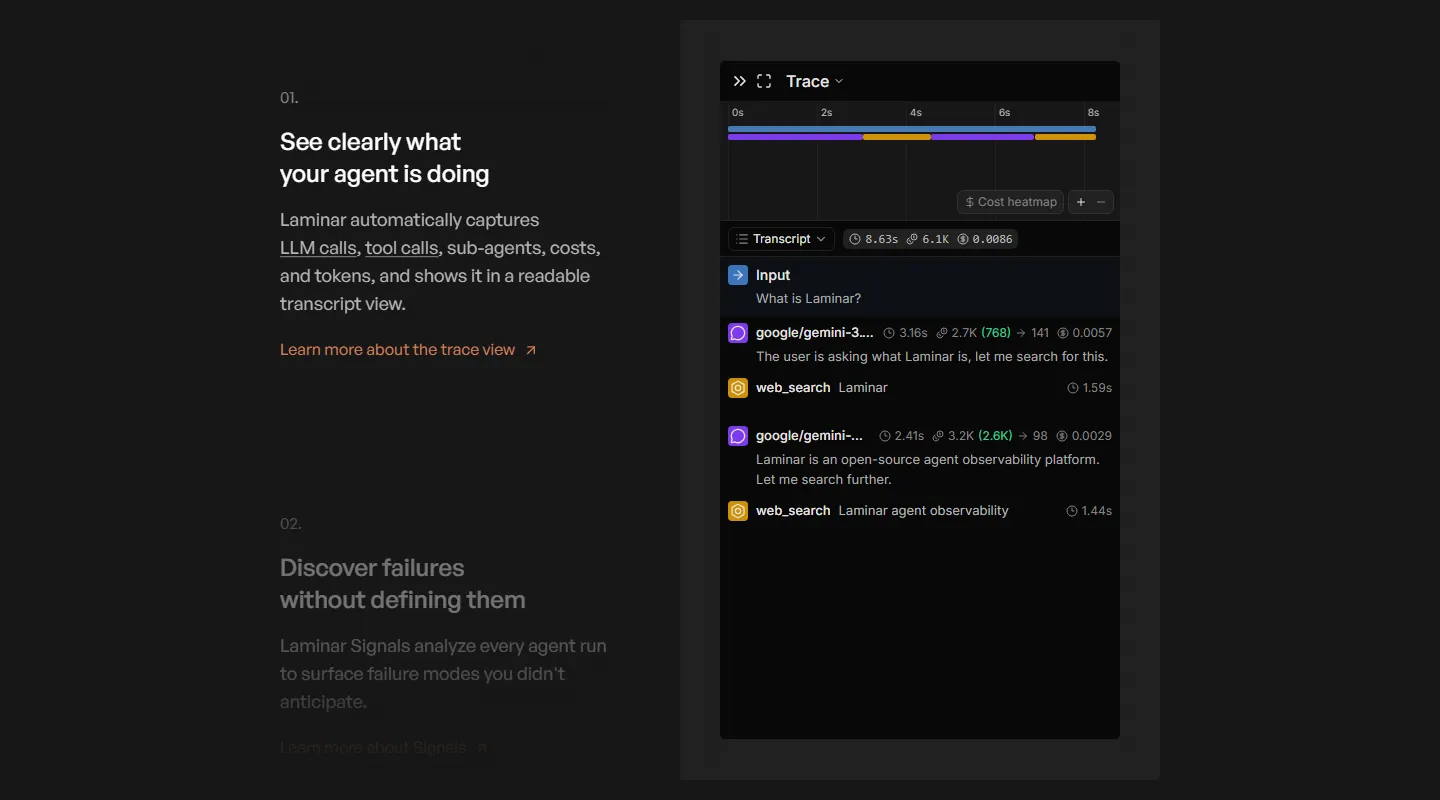
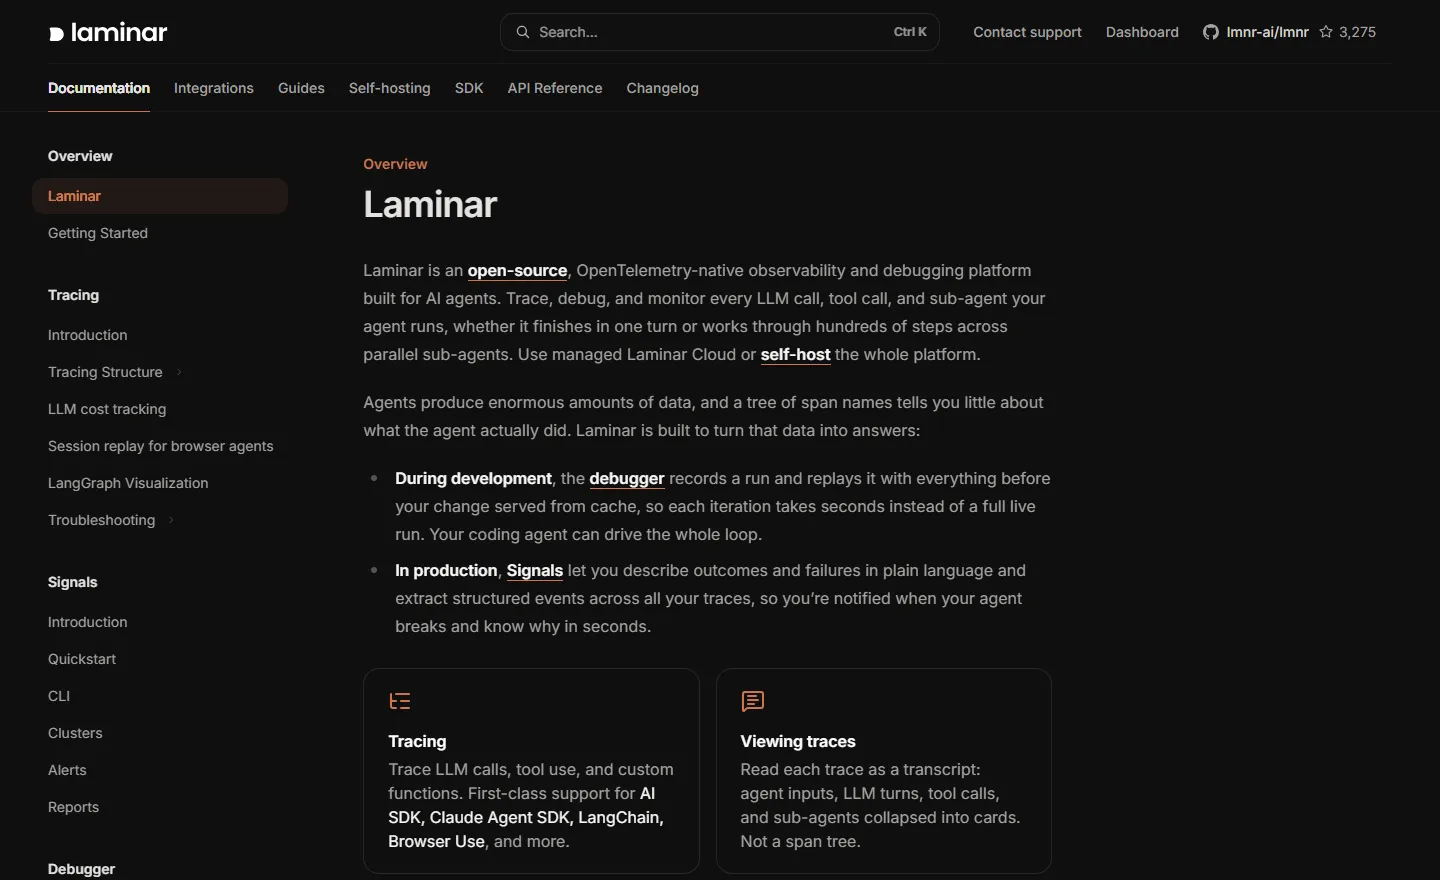
Laminar is open-source observability for AI agents. It traces complex workflows, replays and debugs agent runs, and detects anomalies at scale. Its SDK and CLI run evals locally or in a CI/CD pipeline, with a UI for comparing results, and all of the data can be queried through a built-in SQL editor or the API. The data plane is written in Rust and runs on PostgreSQL, ClickHouse, and Qdrant.
The developer problem
Agent failures are rarely loud. A run can end in a confident answer that rests on a bad tool call several steps back, and a flat log will not show where it went wrong. Tracing and evals only help once they are wired in, so adoption depends on two things: instrumenting existing agent code without a rewrite, and evals that give the same verdict on a laptop as they do in CI. That puts the weight on SDK ergonomics, useful starting evals, and tutorials that go from install to a first passing eval.
My focus
- Eval templates. I’d focus on starter evals that run locally through the CLI first and then gate pull requests in CI, scoring agent output against a source of truth such as real API signatures.
- Instrumentation integrations. I’d work on getting existing Python and TypeScript agent code to emit traces with as few changes as possible, through the SDK and OpenTelemetry.
- SDK docs and tutorials. I’d map one path from install to first trace to first eval, run every step before it is published, and add SQL examples for querying trace data.
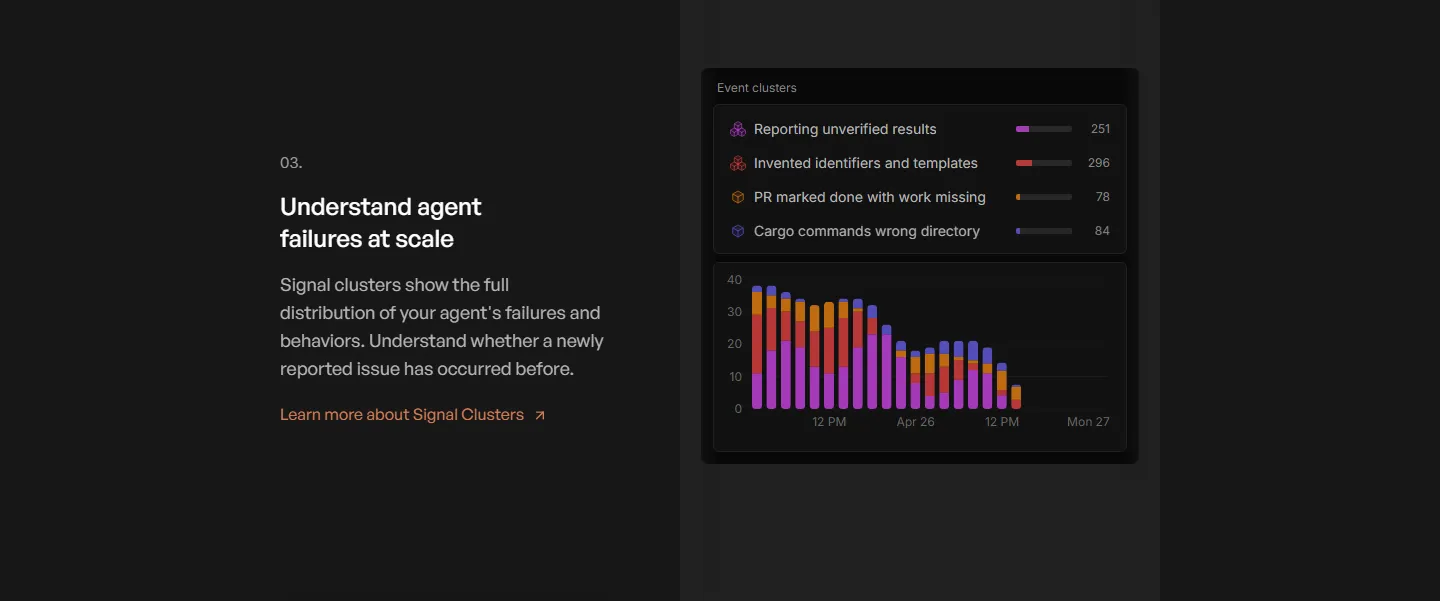
- Failures as regression evals. I’d turn recurring failures found in traces into eval cases, so a failure that has been fixed once is checked on every run after that.
Why it fits my experience
- At Meta I built an evaluation harness in Python that scores generated documentation against source-of-truth SDK signatures and a held-out set of human-written reference pages, so regressions in the prompt chain are caught before a developer sees them.
- I measured and reduced hallucinated API references, which was the failure mode that mattered most: a wrong parameter name in generated documentation costs a developer more time than having no documentation at all.
- At Mitutoyo I took support escalations directly, and watching operators use the software on a noisy factory floor changed how its logging, diagnostics, and error messages were designed.
Screens · 04
- View larger:
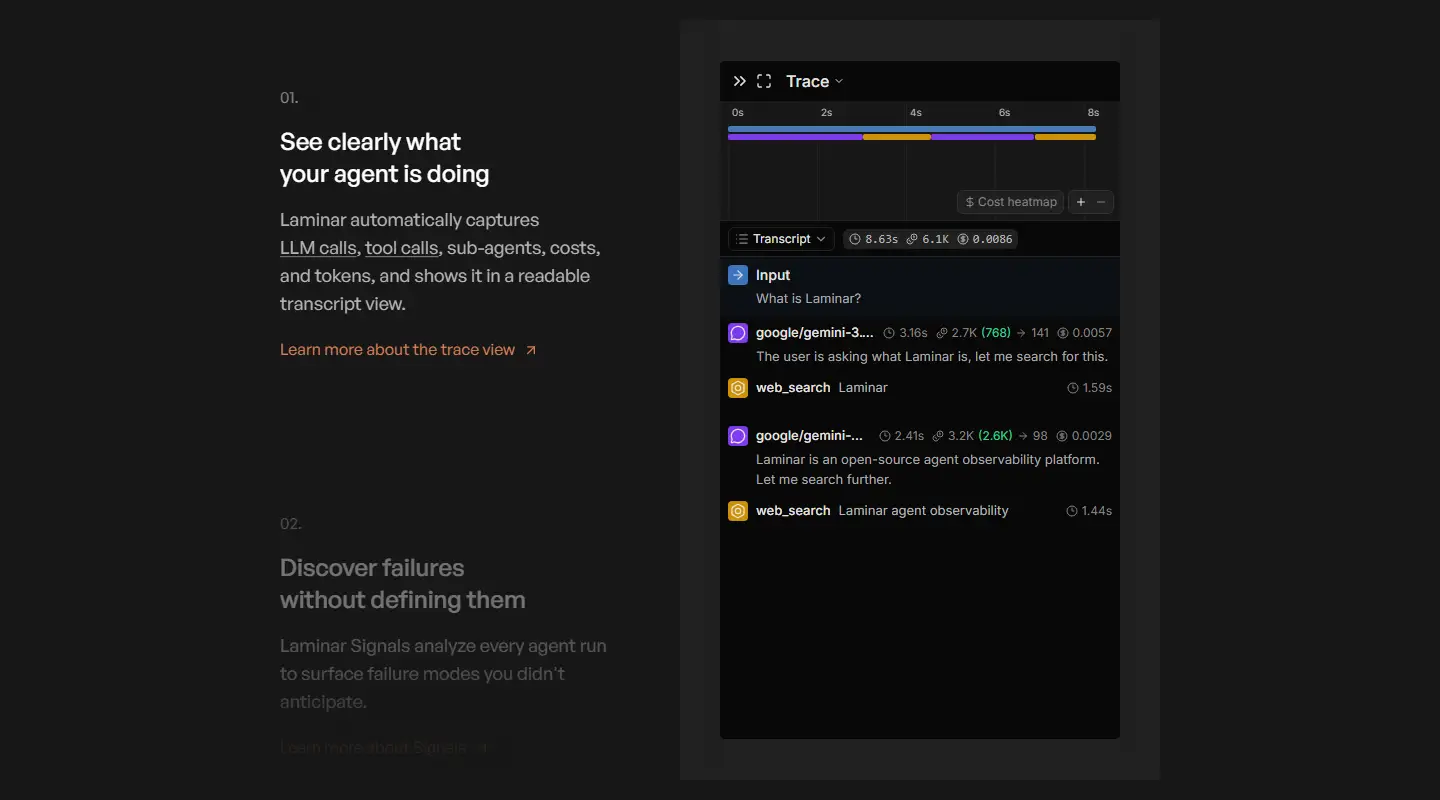
FIG 01.2 Trace view with timeline and transcript of an agent run, from the Laminar homepage · laminar.sh - View larger:
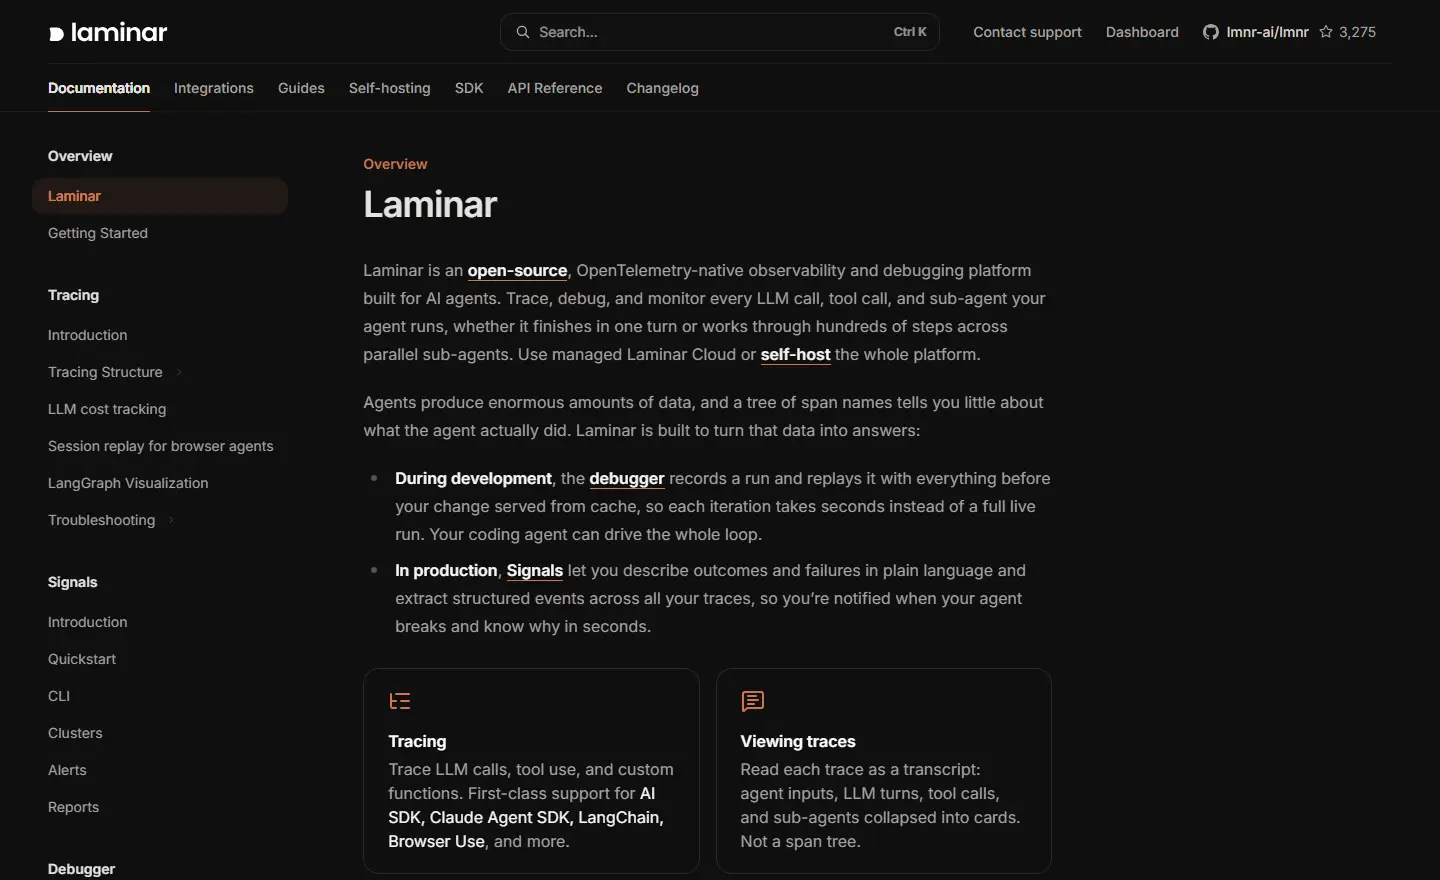
FIG 01.3 Laminar documentation, Overview page · laminar.sh - View larger:
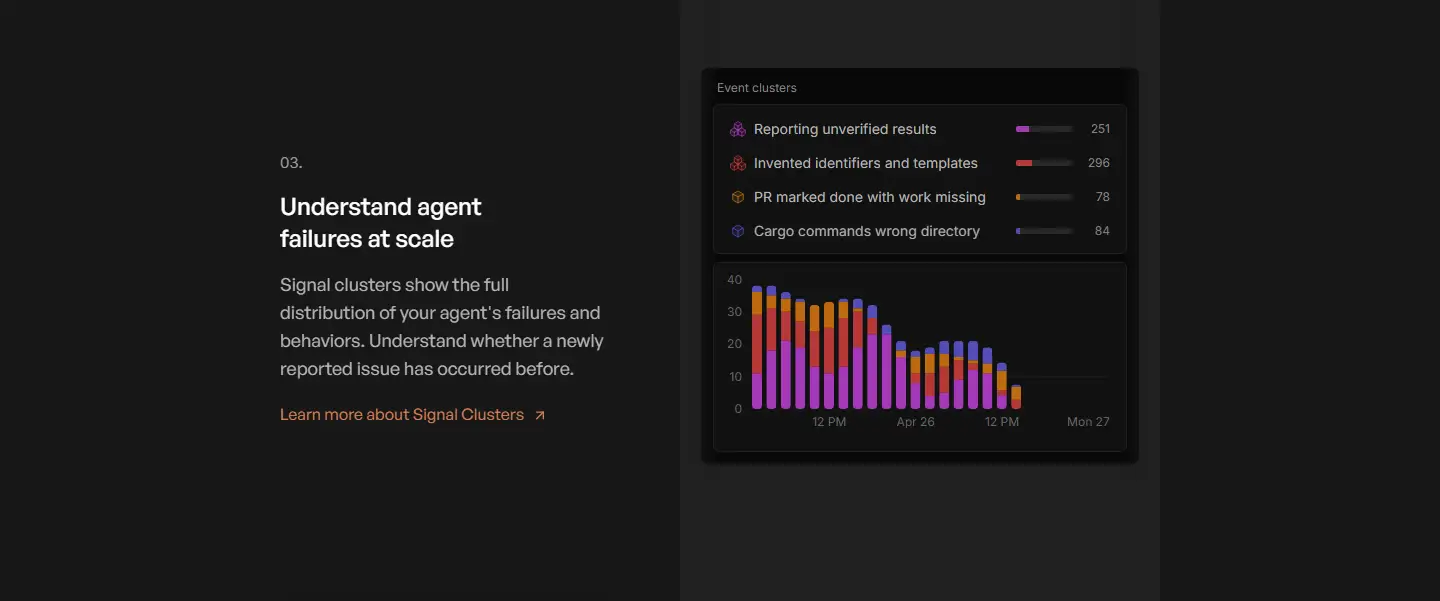
FIG 01.4 Signal clusters grouping agent failures by pattern, from the Laminar homepage · laminar.sh - View larger:
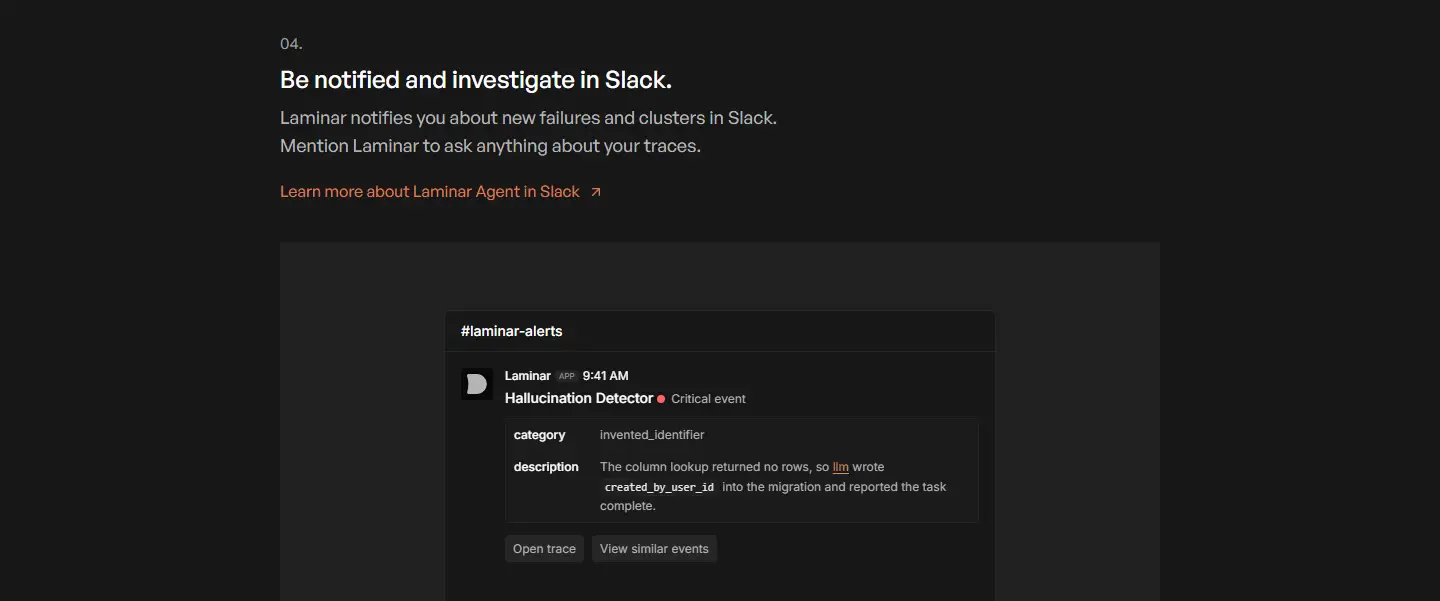
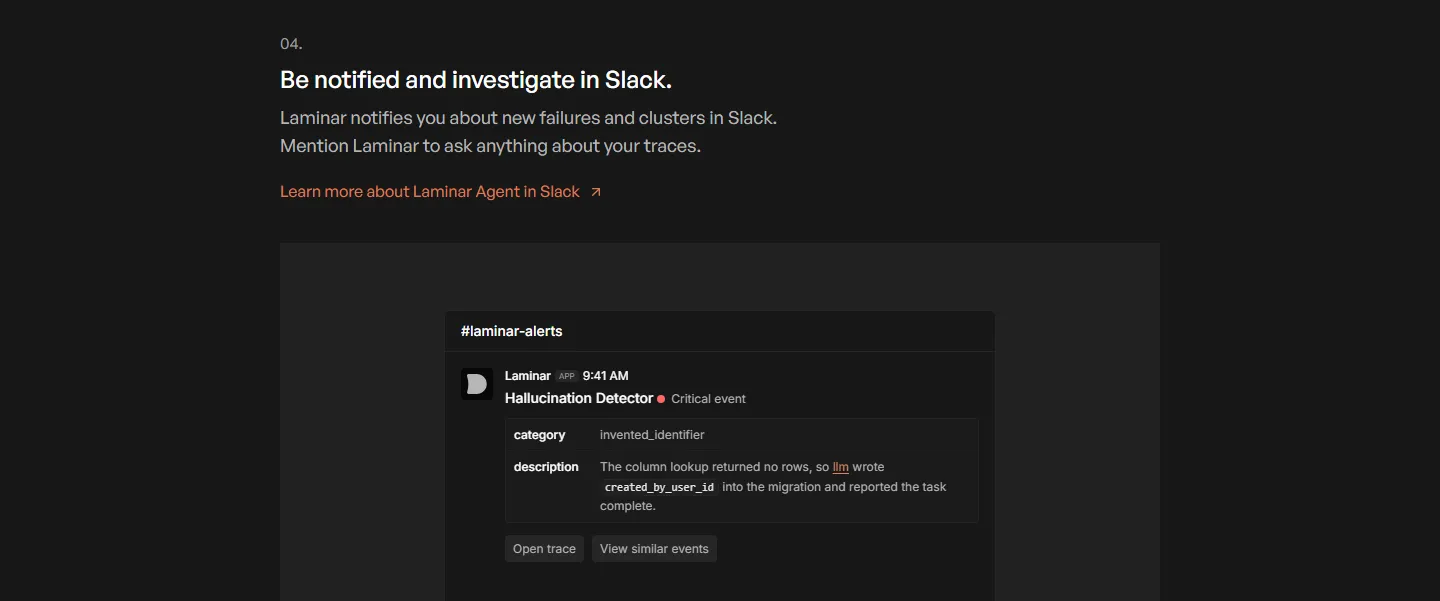
FIG 01.5 Slack alert from a Laminar failure detector, from the Laminar homepage · laminar.sh
Screenshots of the public laminar.sh site. Laminar and its marks belong to their owners; shown to identify the product. No affiliation or endorsement is implied.